The eero cloud is a critical component of the overall architecture that makes every aspect of eero products work. It’s what allows our customers to manage and monitor their home network from around the world. It’s also what enables eero engineers to continuously improve the quality of the experience we deliver to our customers.
At eero, we write most of our cloud services in Scala, a functional-programming inspired language that runs on the Java Virtual Machine (JVM). The JVM uses a memory management strategy called “Garbage Collection” (GC), and understanding the performance of this process is key to understanding the performance of a JVM application overall.
To this end, we developed and open-sourced a tool called Garbagedog, which allows us to continuously monitor the GC performance of any JVM application (without code changes). If you’re familiar with the JVM and garbage collection, you can skip ahead to the details of Garbagedog. Otherwise, here is some background to get you started.
Garbage collection
One of the key features of the JVM is its ability to perform automatic memory management. With this, programmers in languages targeting the JVM don’t have to worry about manually allocating and freeing system memory to hold the information (the objects) their programs require. The JVM accomplishes this with a technique called Garbage Collection (GC).
A garbage collector will request a large pool of memory from the OS and automatically place objects into this pool (the heap) as they are created. As objects are stored in the heap, space available for new objects will decrease. Normally most objects in the heap are only needed by the application for a short time (just long enough to process one web request, user action, etc). Therefore, after that time has passed the memory used to store them can be reclaimed for future allocations. This is done by periodically walking the entire graph of reachable objects in the heap and allowing the space taken by objects not found on this walk (those no longer referenced) to be reused. This reclamation process is the “garbage collection” the system is named for.
Garbage collection performance
Garbage collectors save programmers a lot of work when writing and maintaining code. Unfortunately, this means they must instead do this work at runtime. In fact, they must do more work as they have no a priori knowledge of an object’s lifecycle. A programmer might know that an object will not escape the scope of the function they are writing, but every time that function is called a version of that object will be left on the heap until the garbage collector runs. If the runtime is doing “extra” work, it must affect performance.
There are two significant ways garbage collectors affect application performance:
- The first is on CPU usage:
Like standard code, the garbage collector uses the CPU to do its work. So, when the garbage collector performs its cleanup steps, CPU cycles that could be spent on application code are instead spent on GC. In most modern servers this cost is negligible. CPUs are fast and have plenty of threads. The percentage of CPU time not spent in GC is referred to as throughput. - The second is application pauses:
All garbage collectors that ship with the JVM has operations which cause them to pause all application threads. This is called a stop-the-world (stw) event. Pausing application threads (and thus halting all object creation and access) allows the garbage collector to perform cleanup steps that would otherwise be difficult or impossible to do while the application is running. Some garbage collectors (such as CMS, G1, and Shenandoah) are optimized to limit the frequency and duration of these pauses — but all utilize them for some operations.In some applications, such as batch processing, long pauses are tolerable, or even preferable when they save overall CPU cycles spent in GC. However, in web services with response time goals or in user-facing and real-time systems where even rare latency spikes can severely degrade operation, these pauses must be strictly minimized.
Garbage collection tuning
Luckily for programmers targeting the JVM (and the users of their applications), the garbage collectors provided with the standard HotSpot VM do a pretty good job out of the box. You can simply set a reasonable heap size for your application’s needs and choose an appropriate garbage collector (normally CMS for server workloads) and be on your way. The JVM will use a process called “ergonomics” to automatically tune GC settings to meet a pause time or throughput goal. As your application scales there may be a point where ergonomics is not able to consistently meet your application’s requirements. At that point it’s time to manually tune your GC settings. Each garbage collector that ships with HotSpot offers a myriad of configuration options, and the art and science of such tuning is well covered by other posts.
Continuous monitoring of garbage collection metrics
The process of GC tuning raises two questions: How do you know when you first need to tune your GC settings, and how do you make sure your tuning is still effective as your application changes? To start, the JVM exposes some GC metrics over JMX, and there are libraries such as kamon that emit some of these metrics over statsd. However, the most complete record of GC is found in the GC log, which can be optionally enabled. These logs are very detailed and can be loaded into an application like gcplot for analysis. At eero, for initial tuning we use a combination of YourKit and gcplot. Once tuning is finished we monitor basic stats with kamon. For a while this is all we had, but it became clear that there was a large gap between what gcplot could pull from the logs and what kamon exposed into our metrics stack. To bridge this gap we created and recently open sourced a tool called Garbagedog.
Garbagedog
Garbagedog is a small python application that tails a JVM GC log as it is produced, calculates a handful of statistics, and emits them over dogstatsd. It currently supports the Parallel and CMS collectors and tracks the following metrics:
- Timing by event type (garbagedog_gc_event_duration):
- This is a histogram timing metric for every gc event type. Critically this allows you to break out the timing of stop-the-world events so you can monitor the worst-case pauses your application is seeing.
- Allocation rate (garbagedog_allocation_rate_histogram):
- The rate at which your application is allocating memory. Monitoring this over time lets you monitor the performance implications of code changes.
- Promotion rate (garbagedog_promotion_rate_histogram):
- The rate at which objects are promoted into the old generation.
- Old gen GC frequency (garbagedog_time_between_old_gc)
- Young gen GC frequency (garbagedog_time_between_young_gc)
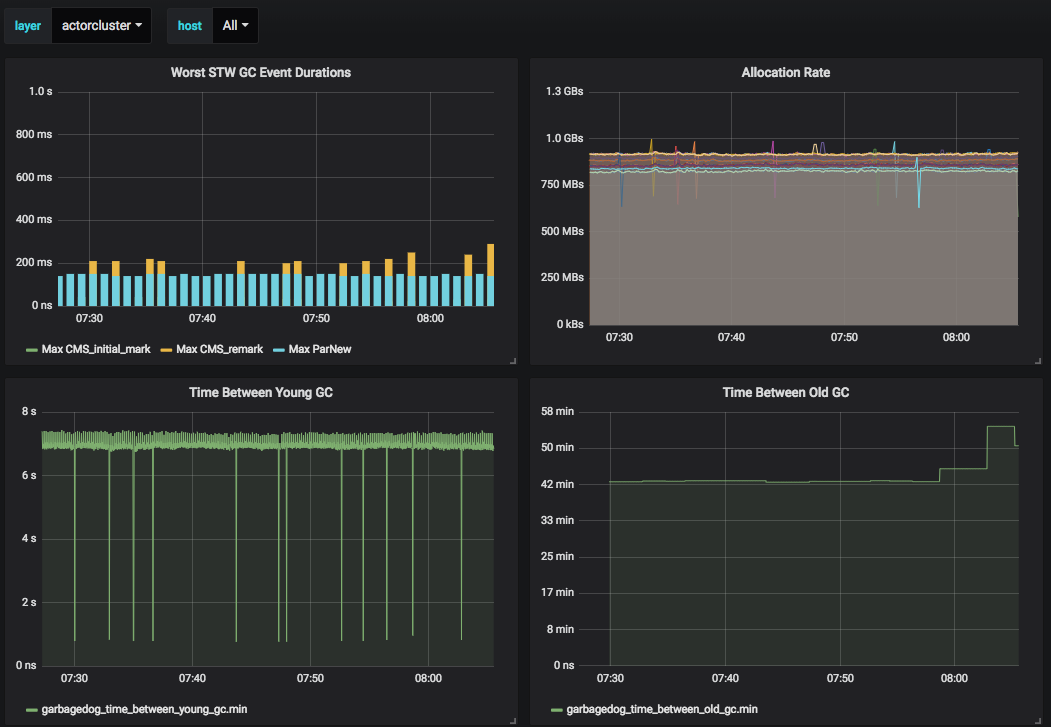
An example of one of our garbagedog monitoring dashboards:
Deployment
Garbagedog started as a hackweek project in August 2017 and has run in production continuously since then. We package Garbagedog as a standalone executable pex, and binaries for Linux and OS X are available here. In production at eero, Garbagedog is configured to emit dogstatsd to a local telegraf agent, which in turn sends that information to our influxdb deployment. From there, we use grafana to graph and alert on the metrics stored in influx.
Conclusion
Garbagedog provides us with some critical GC metrics in real time, but its overall feature set remains limited. There’s a lot you can do with the ability to watch the gc log, and going forward we’d like add features like tenuring distribution tracking, support for the Shenandoah and G1 collectors, and more. Of course, we welcome contributions and feedback to the project. Plus, if you’re interested in this kind of stuff, eero is hiring!
Written by Will Bertelsen, a Cloud Platform engineer at eero.

You must be logged in to post a comment.