WiFi has become a core utility in many U.S. homes, along with water and electricity, playing an indispensable role in our daily lives. While the growth of connected devices can be quantified with industry studies and statistics, what’s less clear is how WiFi is changing habits and digital consumption in our homes.
Using data collected from hundreds of thousands of eeros and results from over 2,000 survey respondents, eero’s second consumer data report explores trends in connected device adoption, usage patterns, and behaviors, broken out across regions and by gender and age. For the purpose of this report, we collected anonymized data from eero networks in 10 major metropolitan areas around the U.S.
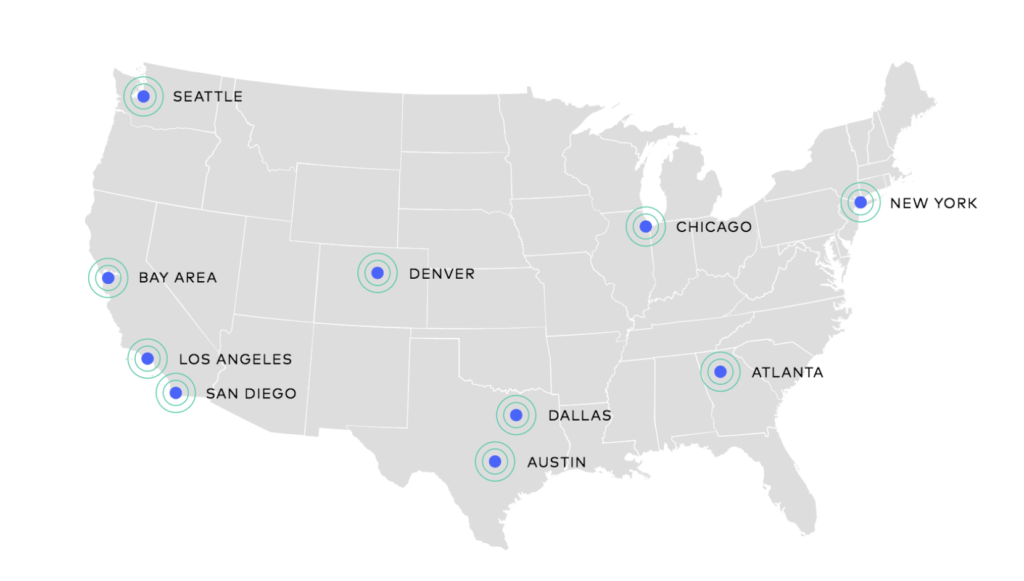
Device Trends
 are the most “connected,” and how they feel about the security of their technology.
Fun fact: Austin’s tech scene has been on the rise for the last few years, and it’s currently leading in the U.S. as the city with the most connected devices – giving the Bay Area a run for its money.
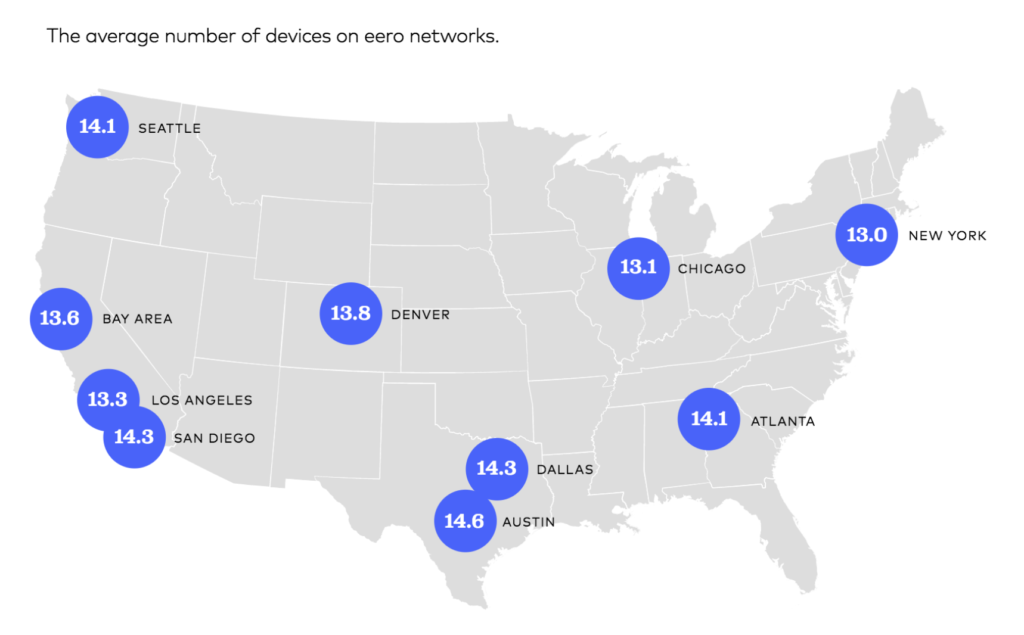
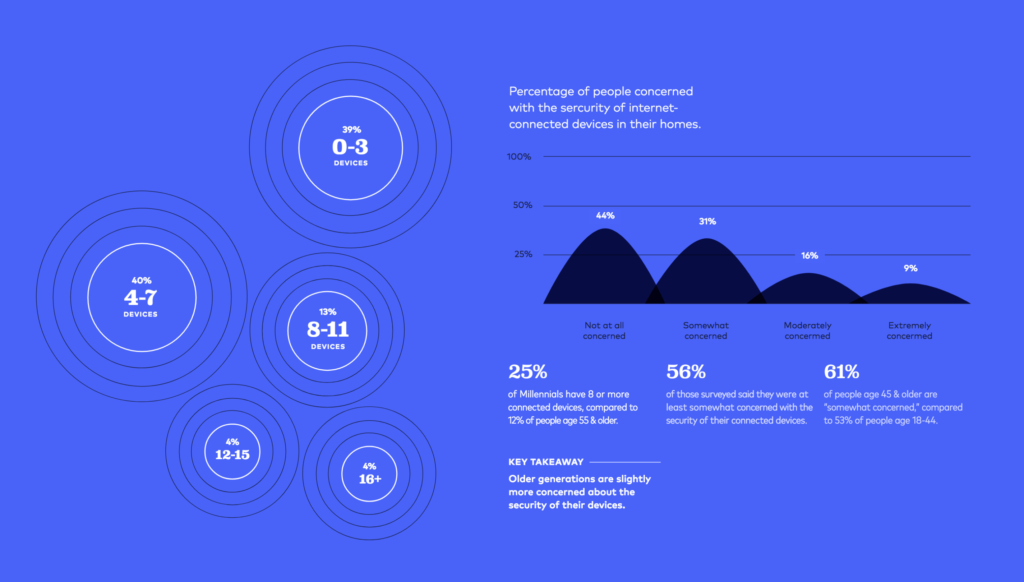
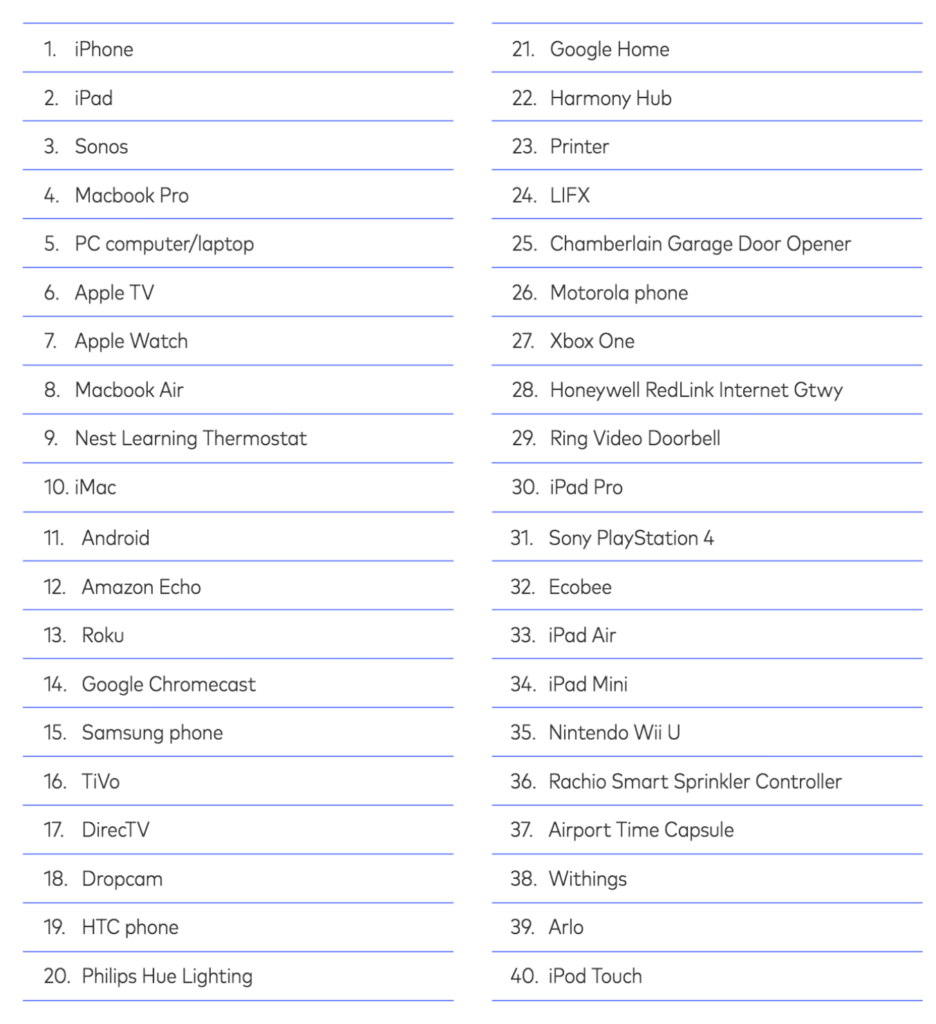
Connected devices
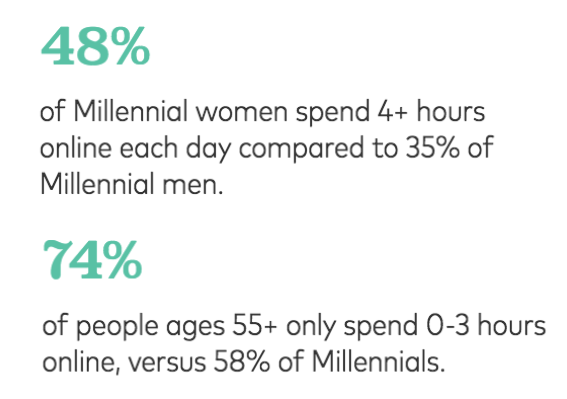
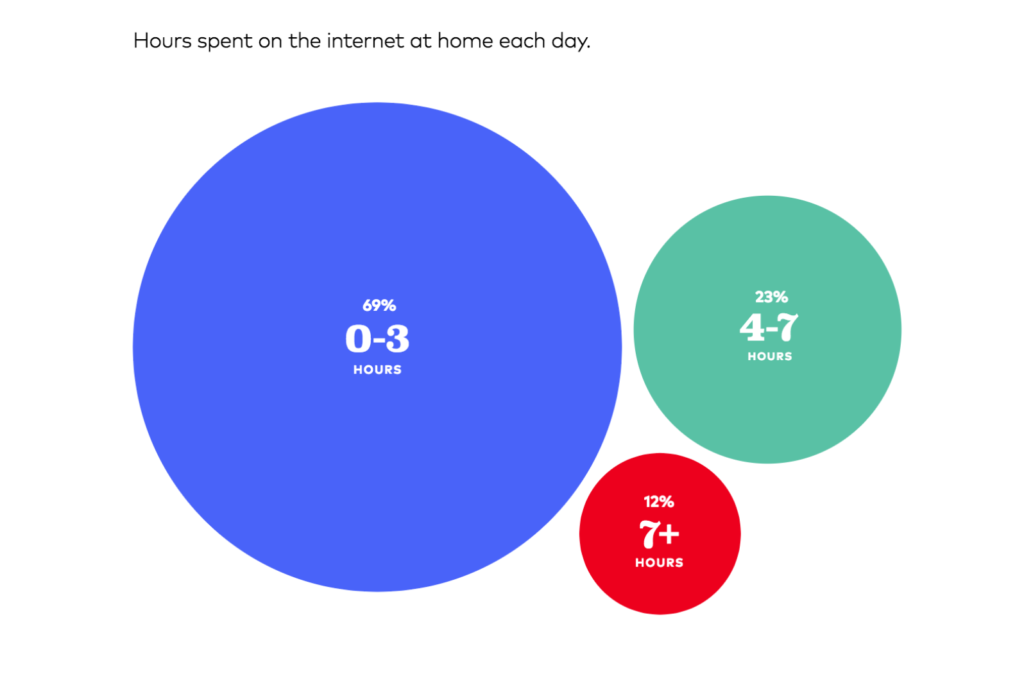
Time on the internet
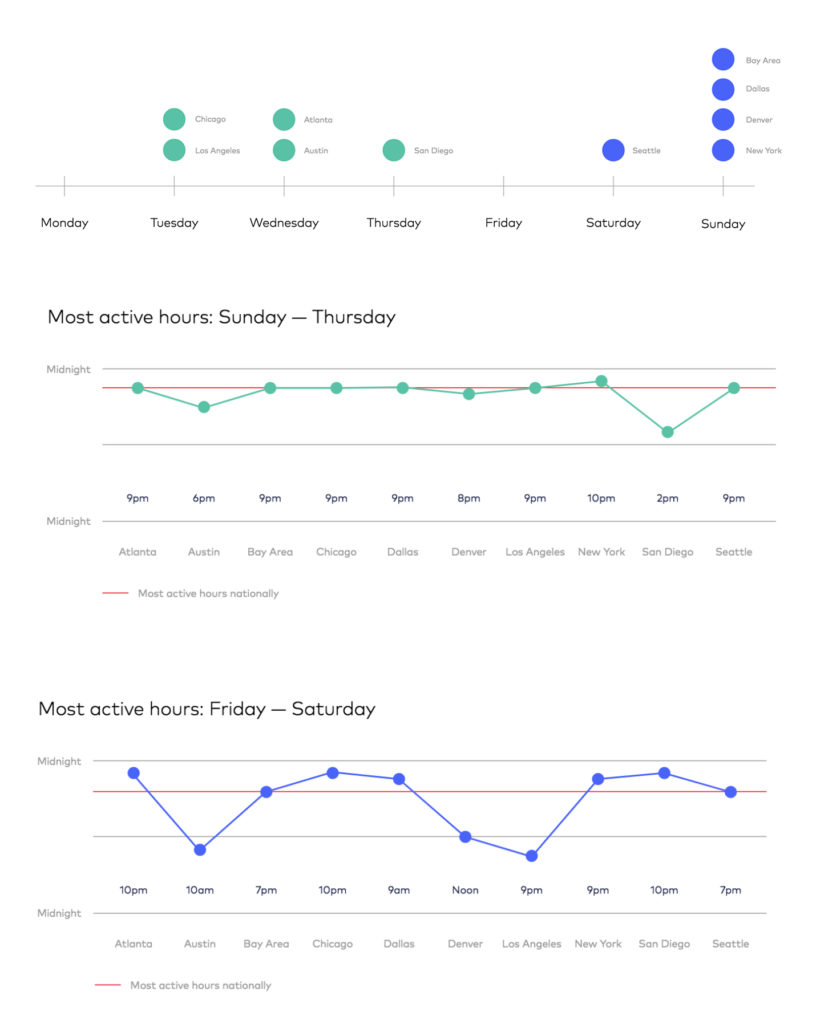
 days of the week — networks see the most traffic, and how people interact with connected devices throughout the day.
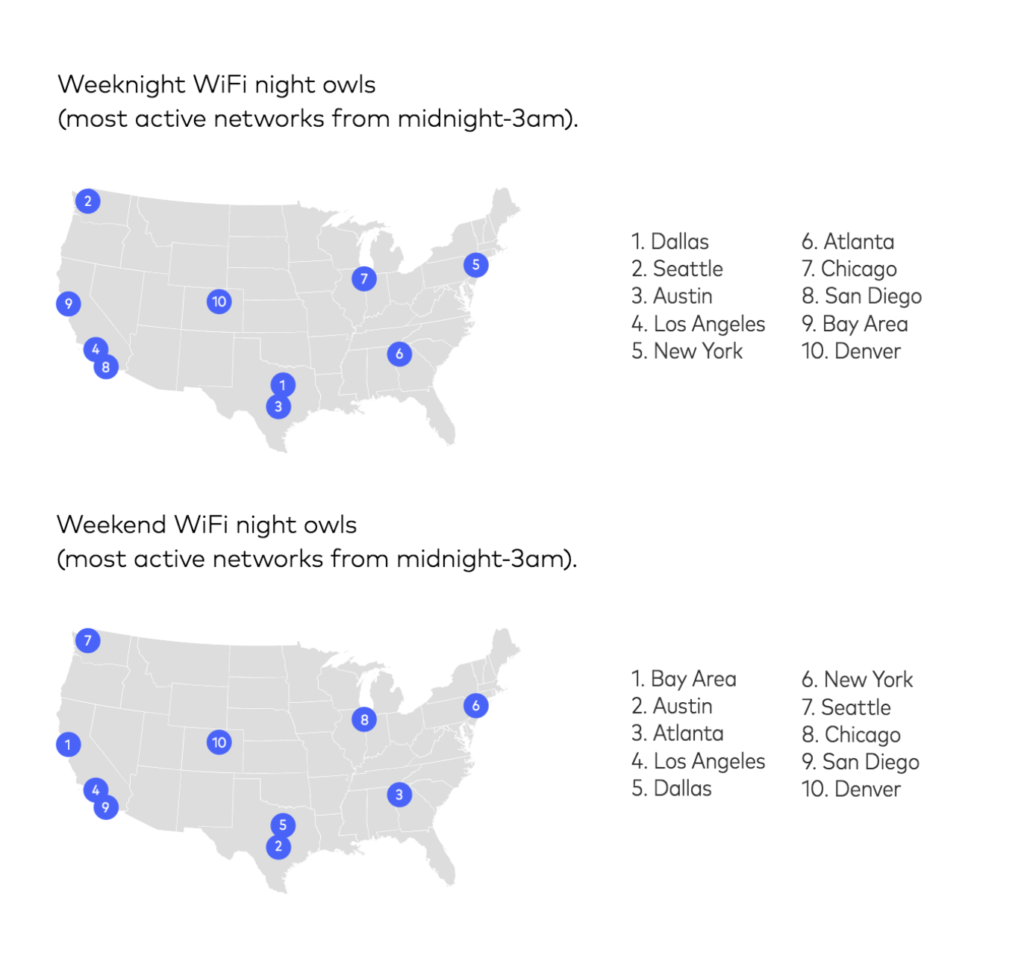
Most active days of the week on eero networks
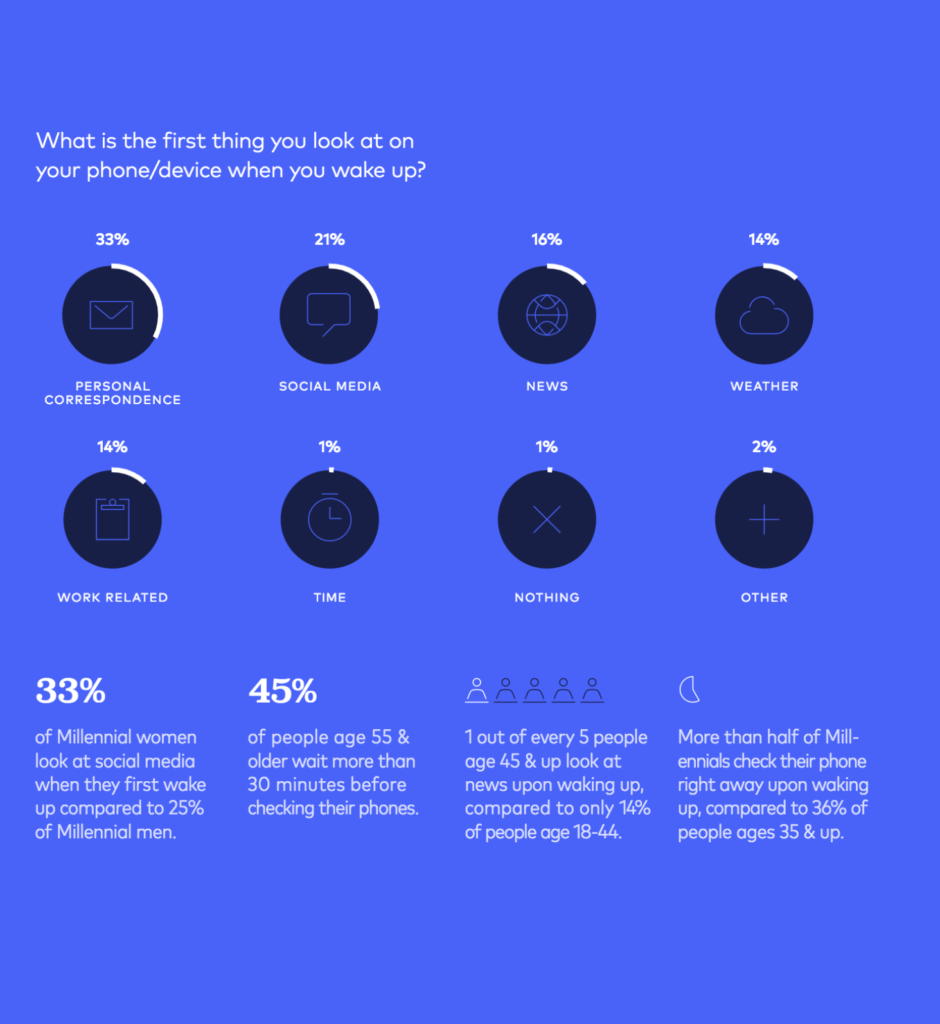
How long are people awake before checking their smartphone?
42% check their phone within 0-10 minutes
32% check their phone 31+ minutes
27% check their phone within 11-30 minutes
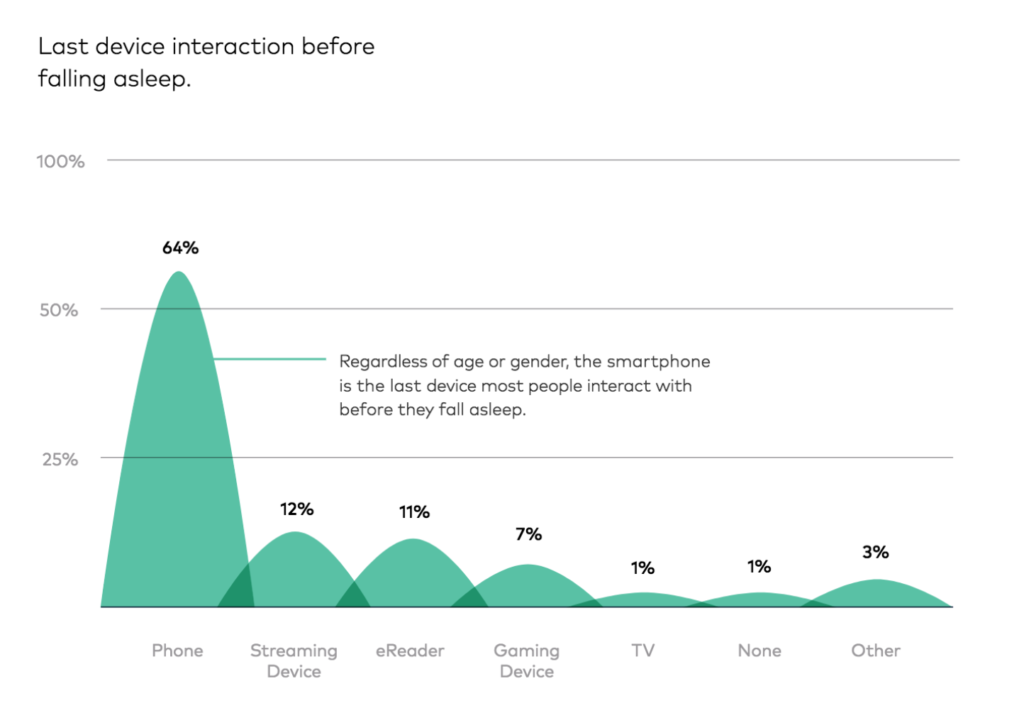
Fun fact: Most people spend a significant amount of time on their devices before falling asleep. Sleep.org recommends at least 30 minutes of screen-free time before bed for better sleep.
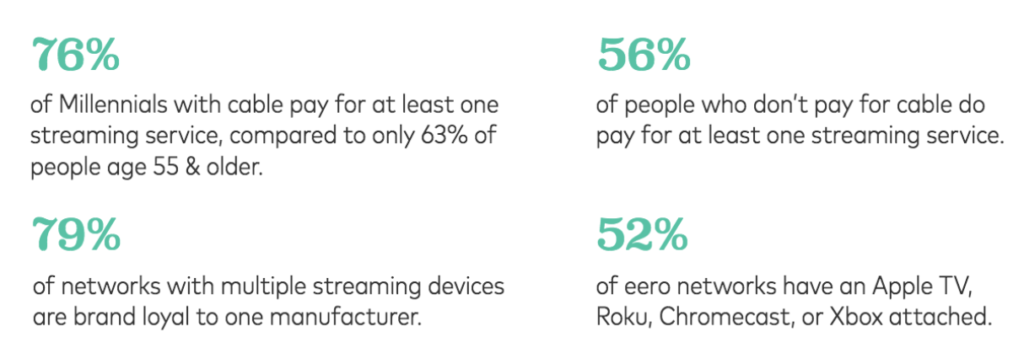
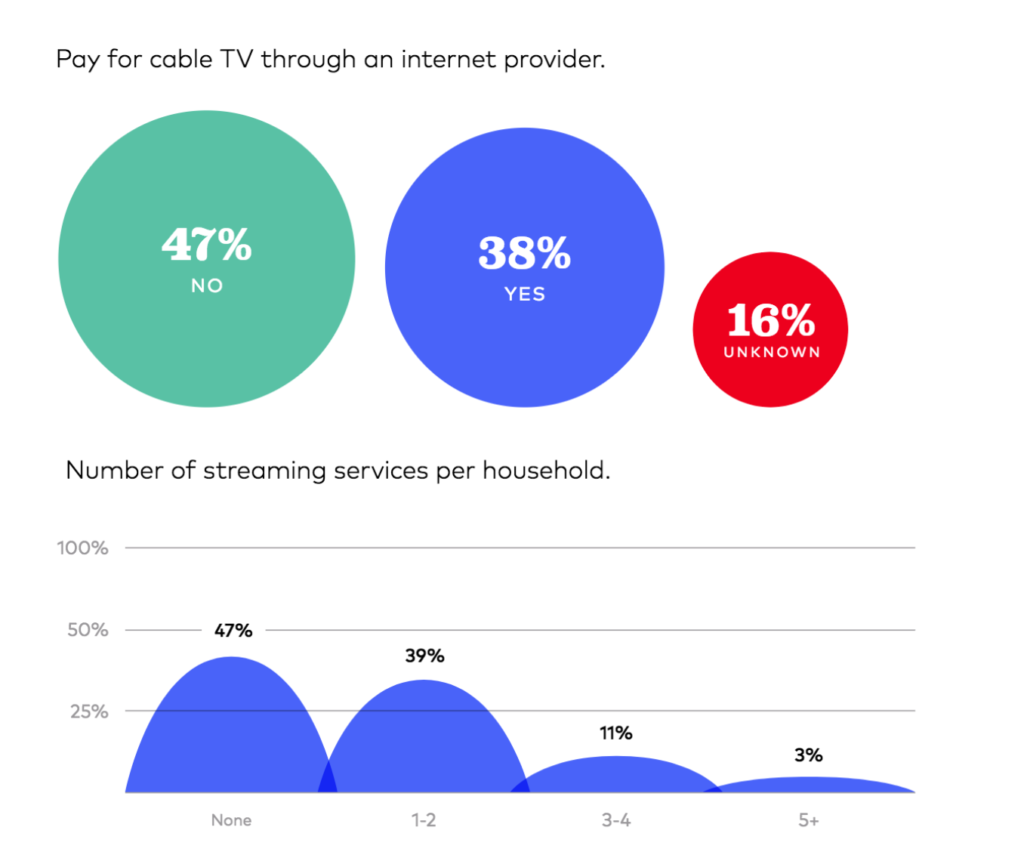
Cord cutters anonymous
eero device index

You must be logged in to post a comment.